
The valuation methodologies of Future Free Cash
Flows (FFCF) and Economic Value Added ($EVA®) result in
identical values. In both cases it is important to ensure that we have
determined a true Economic Capital Base and also sustainable NOPAT's into the
future. In both cases the value that is calculated depends upon the
number of accounting adjustments (reversal of accounting entries) that are made.
Consequently there can be many different $EVA®'s or
FFCF's that are calculated
across a broad spectrum of companies and certainly within the one company. This is
unfortunate and up until now has been a major problem with adopting Economic Value Added
(EVA®). Many large corporations have seen the power and
importance of using EVA® as a Value Based Management (VBM)
system to run their business and to monitor and assess strategies and financial
performance. However they face the well documented problem that their EVA® depends upon what Accounting entries are reversed. Another
problem is that Economic Based decisions tend to always differ from decisions based on
accounting principles and taxation factors. Such decisions as capitalisation of operating
leases, capitalisation and amortisation of Research and Development expenditures, transfer
pricing and valuation of trading stock.
What limits a Corporation in making these adjustments is the time involved, the cost
involved, the knowledge required and also the necessity to maintain the integrity of their
legally required reporting systems. Many corporations end up with a system that is
difficult to maintain and understand and involving only a few (2 to 5) adjustments.
Let their be no misunderstanding as to the importance and impact on value of making the
reversal of these accounting entries. In the United States there are over 100
accounting entries that distort cash flow timing and where the entry itself has absolutely
No Cash Flow associated with it (e.g. provisions).
The combination of all these adjustments adds up and in majority of
Corporations is
substantial. Without questions all these type of entries should be reversed. Our
system caters for the adjustments both selectively and/or in total.
If you have any doubt about this statement then take a quick look at
the following 2 Corporations and just see how big an impact the reversal process has.
Although the year ended was back in 2000 the principle and situation still
applies today in many companies and the two cases emphasis the situation very clearly.
SWe have used two Australian publicly listed companies
Sample_1
Sample 2
Disclaimer
![]()
(refer
disclaimer)
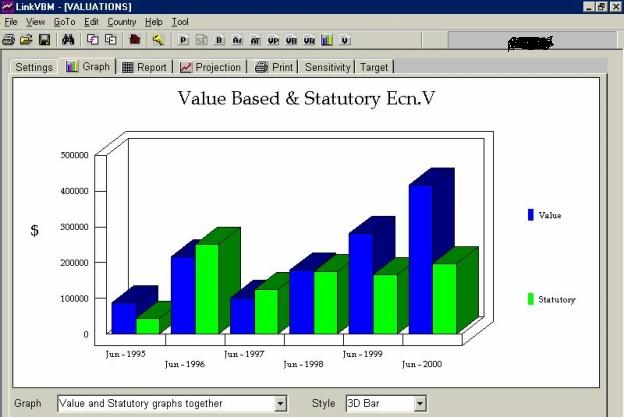
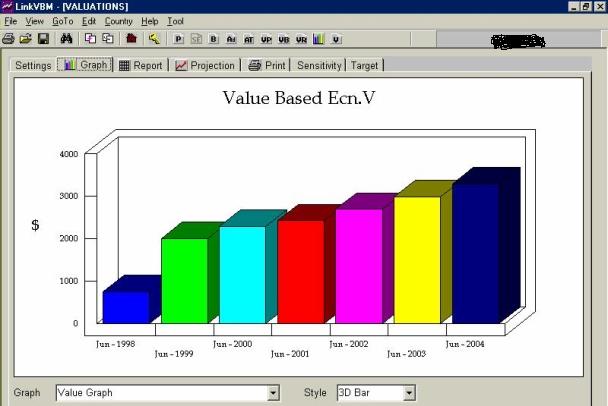
The following graph shows the comparison of Value
Based and Statutory EVA® for the Years Ended 30/06/1995 to 30/06/2000. It can be seen
that there is a substantial difference between the 2 EVA®'s. Value Based EVA® for Year
Ended 30/06/2000 is more than 2 times larger than the Statutory EVA®. The
significance of this and the importance of using Value Based Accounts can be seen when we
look at what the Market is expecting this Company to achieve in order to substantiate the
Share Price of $10.19 as depicted in the next Graph being
Market Price $10.19 as at 6th July 2001.
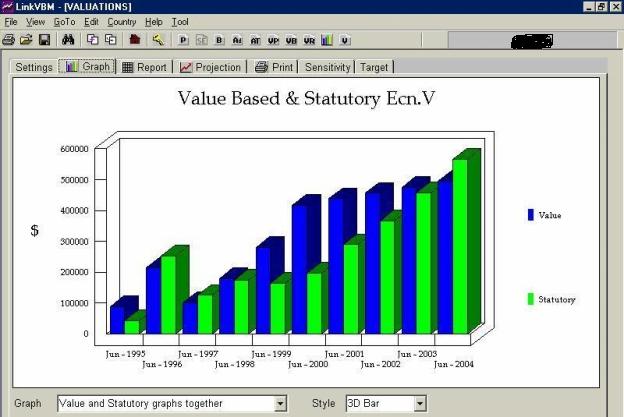
Using the Value Based Accounts the increase in EVA® over the next 4 years 2001 to 2004 appears more than reasonable and achievable (underpriced?). Compare this to the increase that is required in the Statutory EVA® where the increase required is 186% over 4 years from 2001 to 2004.
![]()
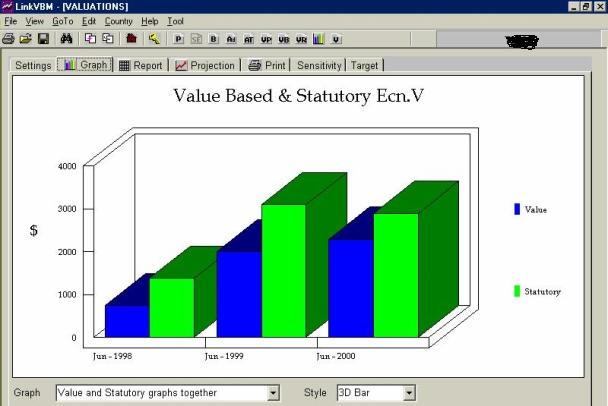
The following graph shows the comparison of Value Based and Statutory EVA® for the Years Ended 30/06/1998 to 30/06/2000.It can be seen that there is a steady upward increase and trend in the Value Based EVA®. The writing back of provisions has caused the Statutory EVA® to exceed the Value Based EVA®. There is no cash flow associated with this write back and certainly no future cash flow. It is interesting to note that in the past few months the Share Price of Telstra Corporation Limited has decreased approximately $2 down to $5.08 as at 6th July 2001. Using the Value Based Accounts (data) the next 2 graphs titled Market Price $5.08 as at 6th July 2001 and Market Price $7 show why.
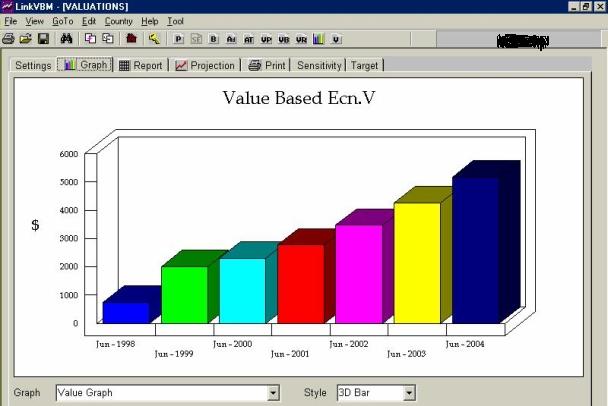
Using the Value Based Accounts with a growth in perpetuity of 1.5% and a Wacc of 8.1%, the increase in EVA® that is required over the next 4 years (2001 to 2004) to substantiate a share price of $7 is substantial (an increase from $2.293b to $5.184b being 126% over 4 years).
Using the Value Based Accounts with a growth in perpetuity of 1.5% and a Wacc of 8.1%, the increase in EVA® that is required over the next 4 years (2001 to 2004) to substantiate a share price of $5.08 is more reasonable (an increase from $2.293b to $3.286b being 43%).
![]()
Disclaimer
Economic Solutions (SA) Pty. Ltd.
Neither Economic Solutions (SA) P/L nor any member or employee of Economic Solutions (SA) P/L undertakes responsibility in any way whatsoever to any person in respect of the above reports, comments and graphs. No one is to rely on the information provided above as it is based on many assumptions and projections that have not been investigated or tested. The reports, comments and graphs must not be used to make any decisions. Readers should refer to their own financial advisers for advice.
Economic Solutions (SA) Pty. Ltd.
EVA® is a registered trade mark of Stern Stewart & Co
![]()
Also sign up as a member and receive a Free Bonus being Our Cash Volume Calculator.
In regards to our Cash Volume Calculator many business owners, businesses and even consultants do not know what cash gain or loss will be derived from a Change in Volume.
For many businesses increased sales mean a decrease in cash flow for the first year due to the need to finance additional working capital (debtors & inventory less trade creditors). The second year cash flow from the increased sales is usually positive (a gain),
Our simple to use Cash Volume Calculator gives you the answers. You may be surprised. At least you should know what will happen when you increase your sales.
Get these Free Gifts when you Opt-In as a member by Filling in your details and clicking on the Submit button below.
NOTE: Only sign up Once else you will get an ERROR page.
Privacy: See statement
![]()
![]()
![]()
Economic Solutions:
email:
Disclaimer:
Privacy:
Copyright © 1997 Economic Solutions (SA) Pty. Ltd